

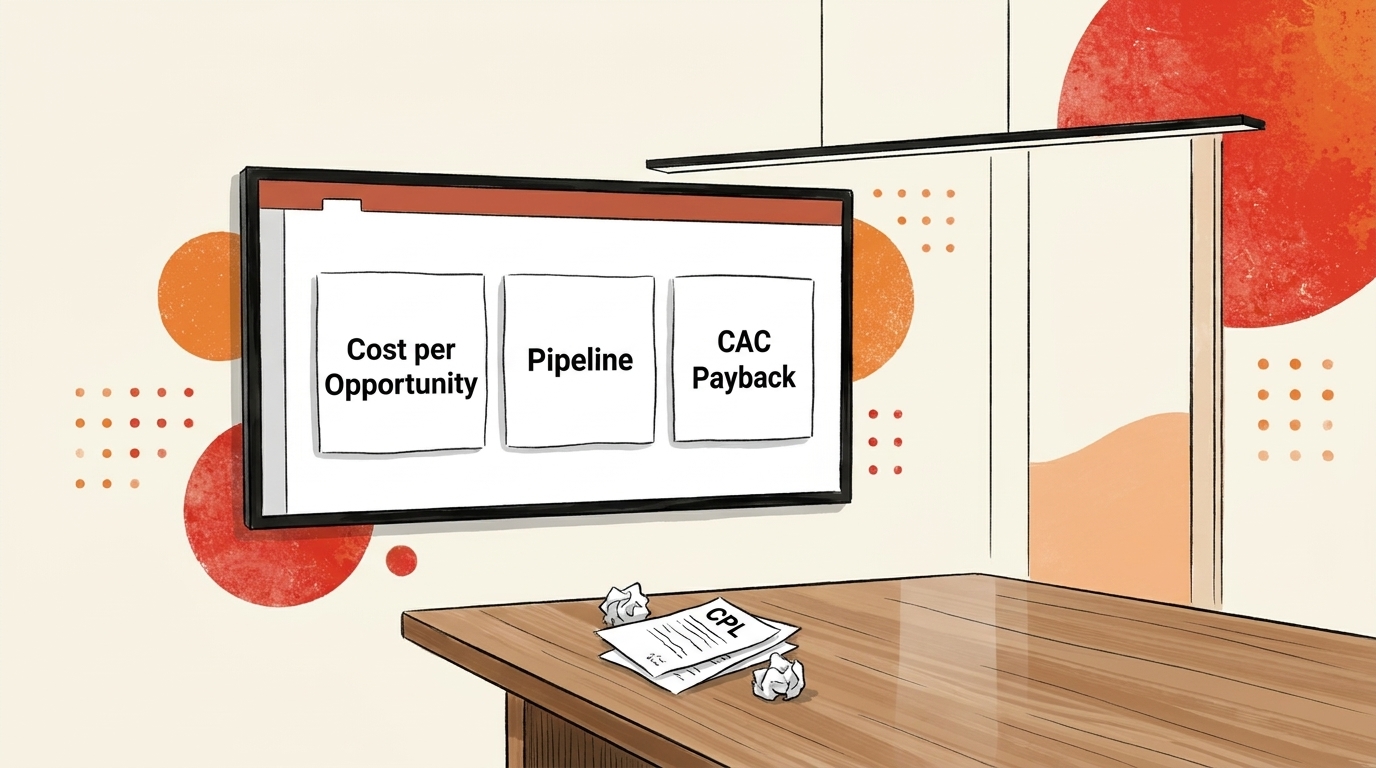
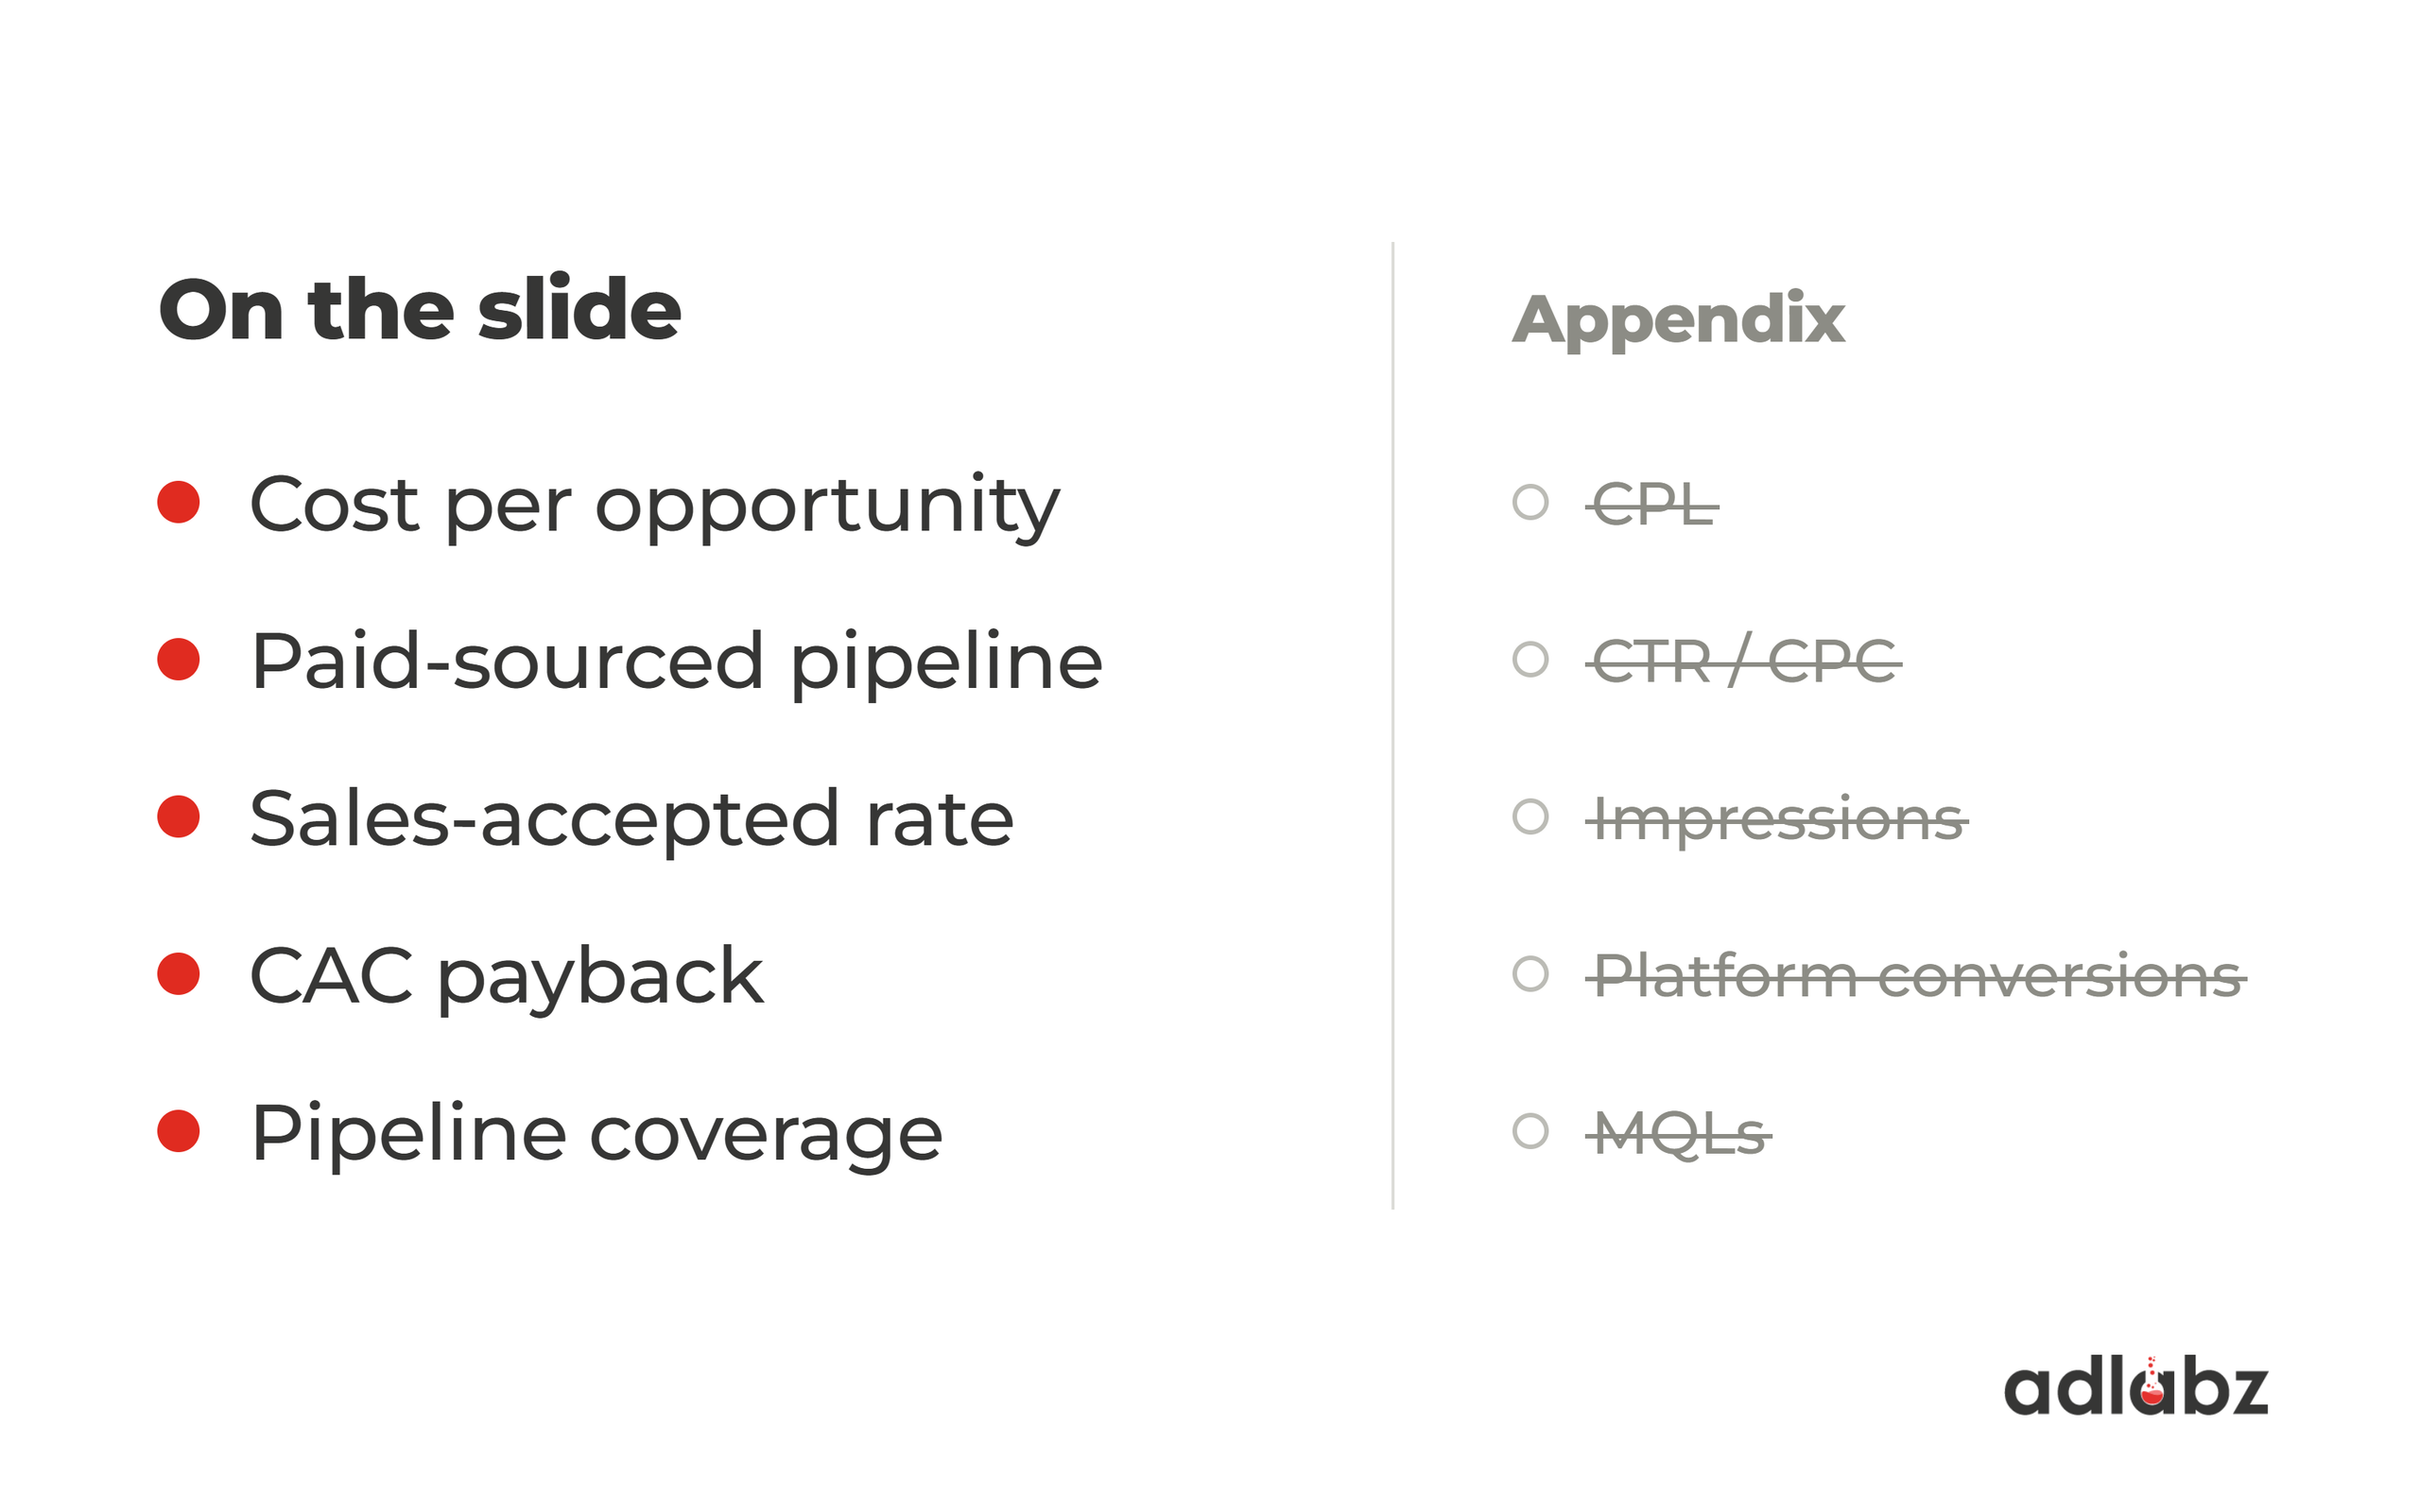
The short answer: The best SaaS board deck metrics for paid media are cost per opportunity, paid-sourced pipeline, sales-accepted rate, CAC payback and paid’s share of pipeline coverage. Cost per lead, click-through rate and the ad platform’s own conversion counts belong in the appendix, not on the slide.
This guide is for marketing and growth leaders at Series A to early Series B SaaS companies spending roughly $10K to $40K a month on paid, who have to defend that spend to a CEO, CFO or board.
Table of Contents
Why cost per lead fails on a board slide
Cost per lead tells the board how cheaply you bought form fills. It says nothing about whether those form fills became revenue.
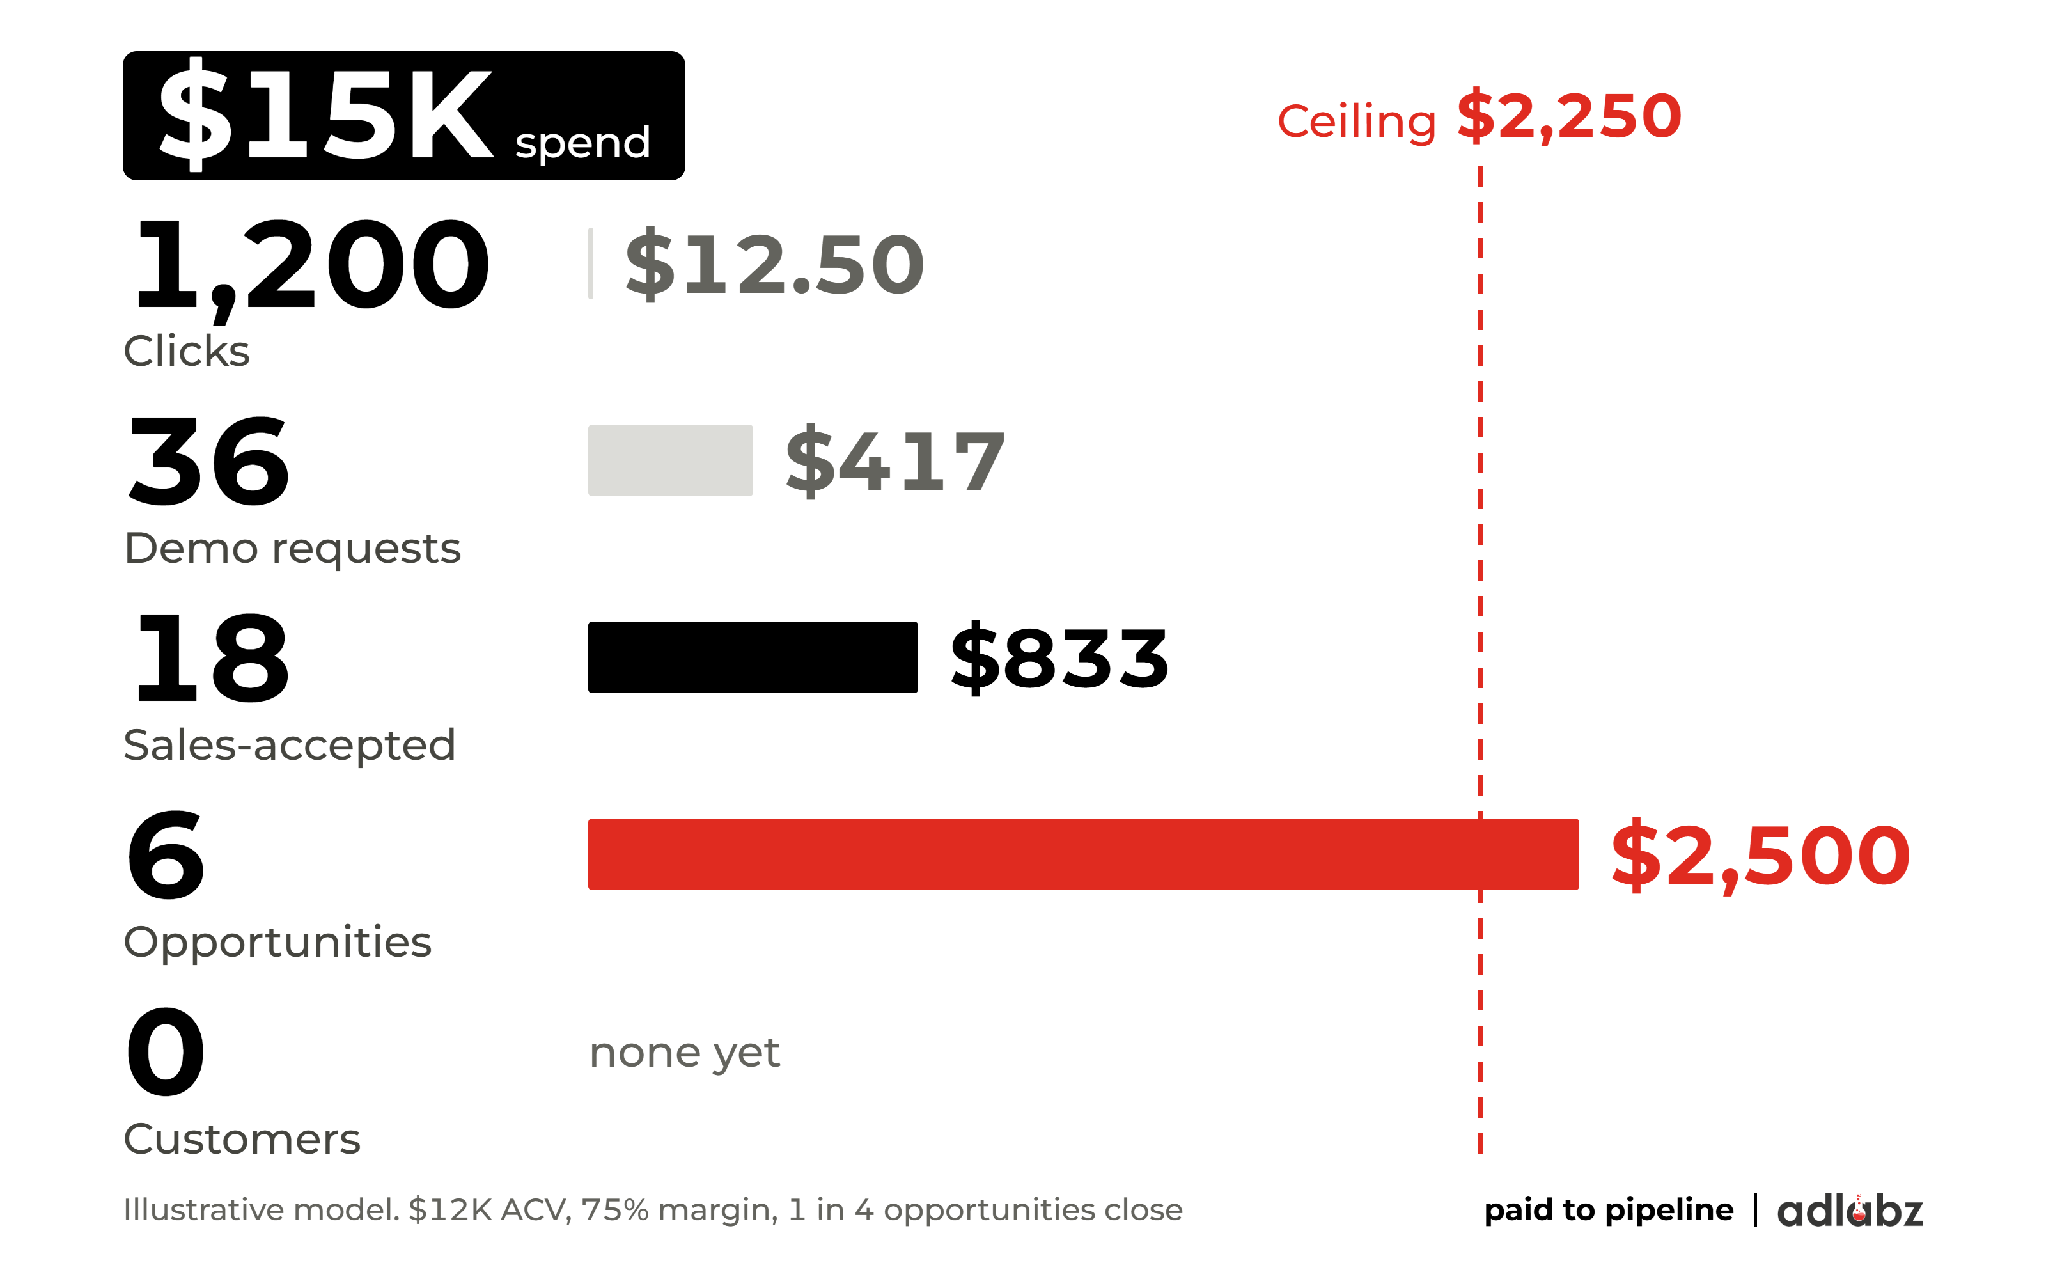
Take an illustrative account: a SaaS company with a $12K annual contract value spends $15K on Google Ads over three months. It gets 36 demo requests at $417 each. That looks healthy. But only 6 of those requests become sales opportunities, so each opportunity costs $2,500. That’s the number that decides whether paid can pay for itself.
A falling CPL can even be bad news. Cheaper leads often come from broader targeting, which brings in more people who will never buy. If you suspect that is happening, here is how to tell if you’re paying for clicks you’ll never close.
A board is asking one question: did paid buy pipeline we can afford? These five metrics answer it.
The 5 SaaS board deck metrics for paid media
1. Cost per opportunity
Formula: paid spend ÷ opportunities created from paid
This is the earliest number that says something real about unit economics. Closed revenue lags spend by a full sales cycle, but opportunities show up within weeks.
To know whether your cost per opportunity is good, compare it with your ceiling, the most you can afford to pay for one:
first-year gross profit per customer × opportunity close rate
At a $12K ACV, 75% gross margin and 1 in 4 opportunities closing, the ceiling is $9,000 × 0.25 = $2,250 per opportunity. Below the ceiling, paid can pay back within a year. Above it, it can’t.
We cover the full method in Cost per Opportunity: 5 Simple Steps to Win Board Trust.
2. Paid-sourced qualified pipeline ($)
Formula: the total value of open and closed opportunities whose original source is paid
Report this in dollars, not as a count. A board reads “$240K of qualified pipeline from paid this quarter” much faster than “20 opportunities”. Take the number from your CRM, never from the ad platform.
3. Sales-accepted rate
Formula: sales-accepted leads from paid ÷ total leads from paid
This is the quality check. It shows whether sales agrees that paid is bringing in real buyers. If CPL is falling and this rate is falling too, paid is buying volume, not demand.
It also settles the most common argument between marketing and sales, and it lets the board see who is right without taking sides.
4. CAC payback (months)
Formula: CAC ÷ (new monthly recurring revenue per customer × gross margin)
CAC payback is the number a CFO and board already use for the whole business, so reporting paid in the same terms makes it easy to compare.
Be explicit about which CAC you mean. Paid CAC (ad spend only) is useful for comparing channels. Fully loaded CAC (spend plus the people and tools behind it) is what finance uses. Label the slide with the one you used, because mixing them is how payback numbers lose credibility in the room.
5. Paid’s share of pipeline coverage
Formula: paid-sourced pipeline ÷ total pipeline needed to hit the new-revenue target
Most boards already track pipeline coverage, the ratio of pipeline to target. This metric shows how much of that coverage paid is carrying. It turns paid from a cost line into a contributor to a number the board already watches.
Summary table
| Metric | Formula | Source of truth | What it tells the board |
|---|---|---|---|
| Cost per opportunity | Spend ÷ paid opportunities | CRM + ad spend | Whether paid can be profitable |
| Paid-sourced pipeline | $ value of paid opportunities | CRM | What paid produced |
| Sales-accepted rate | Accepted ÷ total paid leads | CRM | Whether the leads are real |
| CAC payback | CAC ÷ (new MRR × margin) | Finance | When the spend comes back |
| Share of pipeline coverage | Paid pipeline ÷ pipeline needed | CRM + plan | How much of the target paid carries |
What to drop, or move to the appendix
These numbers aren’t useless. They just answer questions the board isn’t asking.
- Cost per lead. It measures form fills, not buyers.
- Click-through rate and cost per click. These are useful for the team managing campaigns, and meaningless to a board.
- Impressions and reach. They suggest activity, not results.
- Platform conversions and ROAS. Google and LinkedIn count their own conversions their own way, so their numbers rarely match your CRM.
- MQLs. They are a marketing-internal stage. Report sales-accepted leads instead, because sales has agreed those are real.
Keep them in an appendix in case someone asks. Leading with them invites the question “so what did it produce?”
What the slide looks like
One slide. Three headline numbers across the top, a trend underneath and a one-sentence verdict.
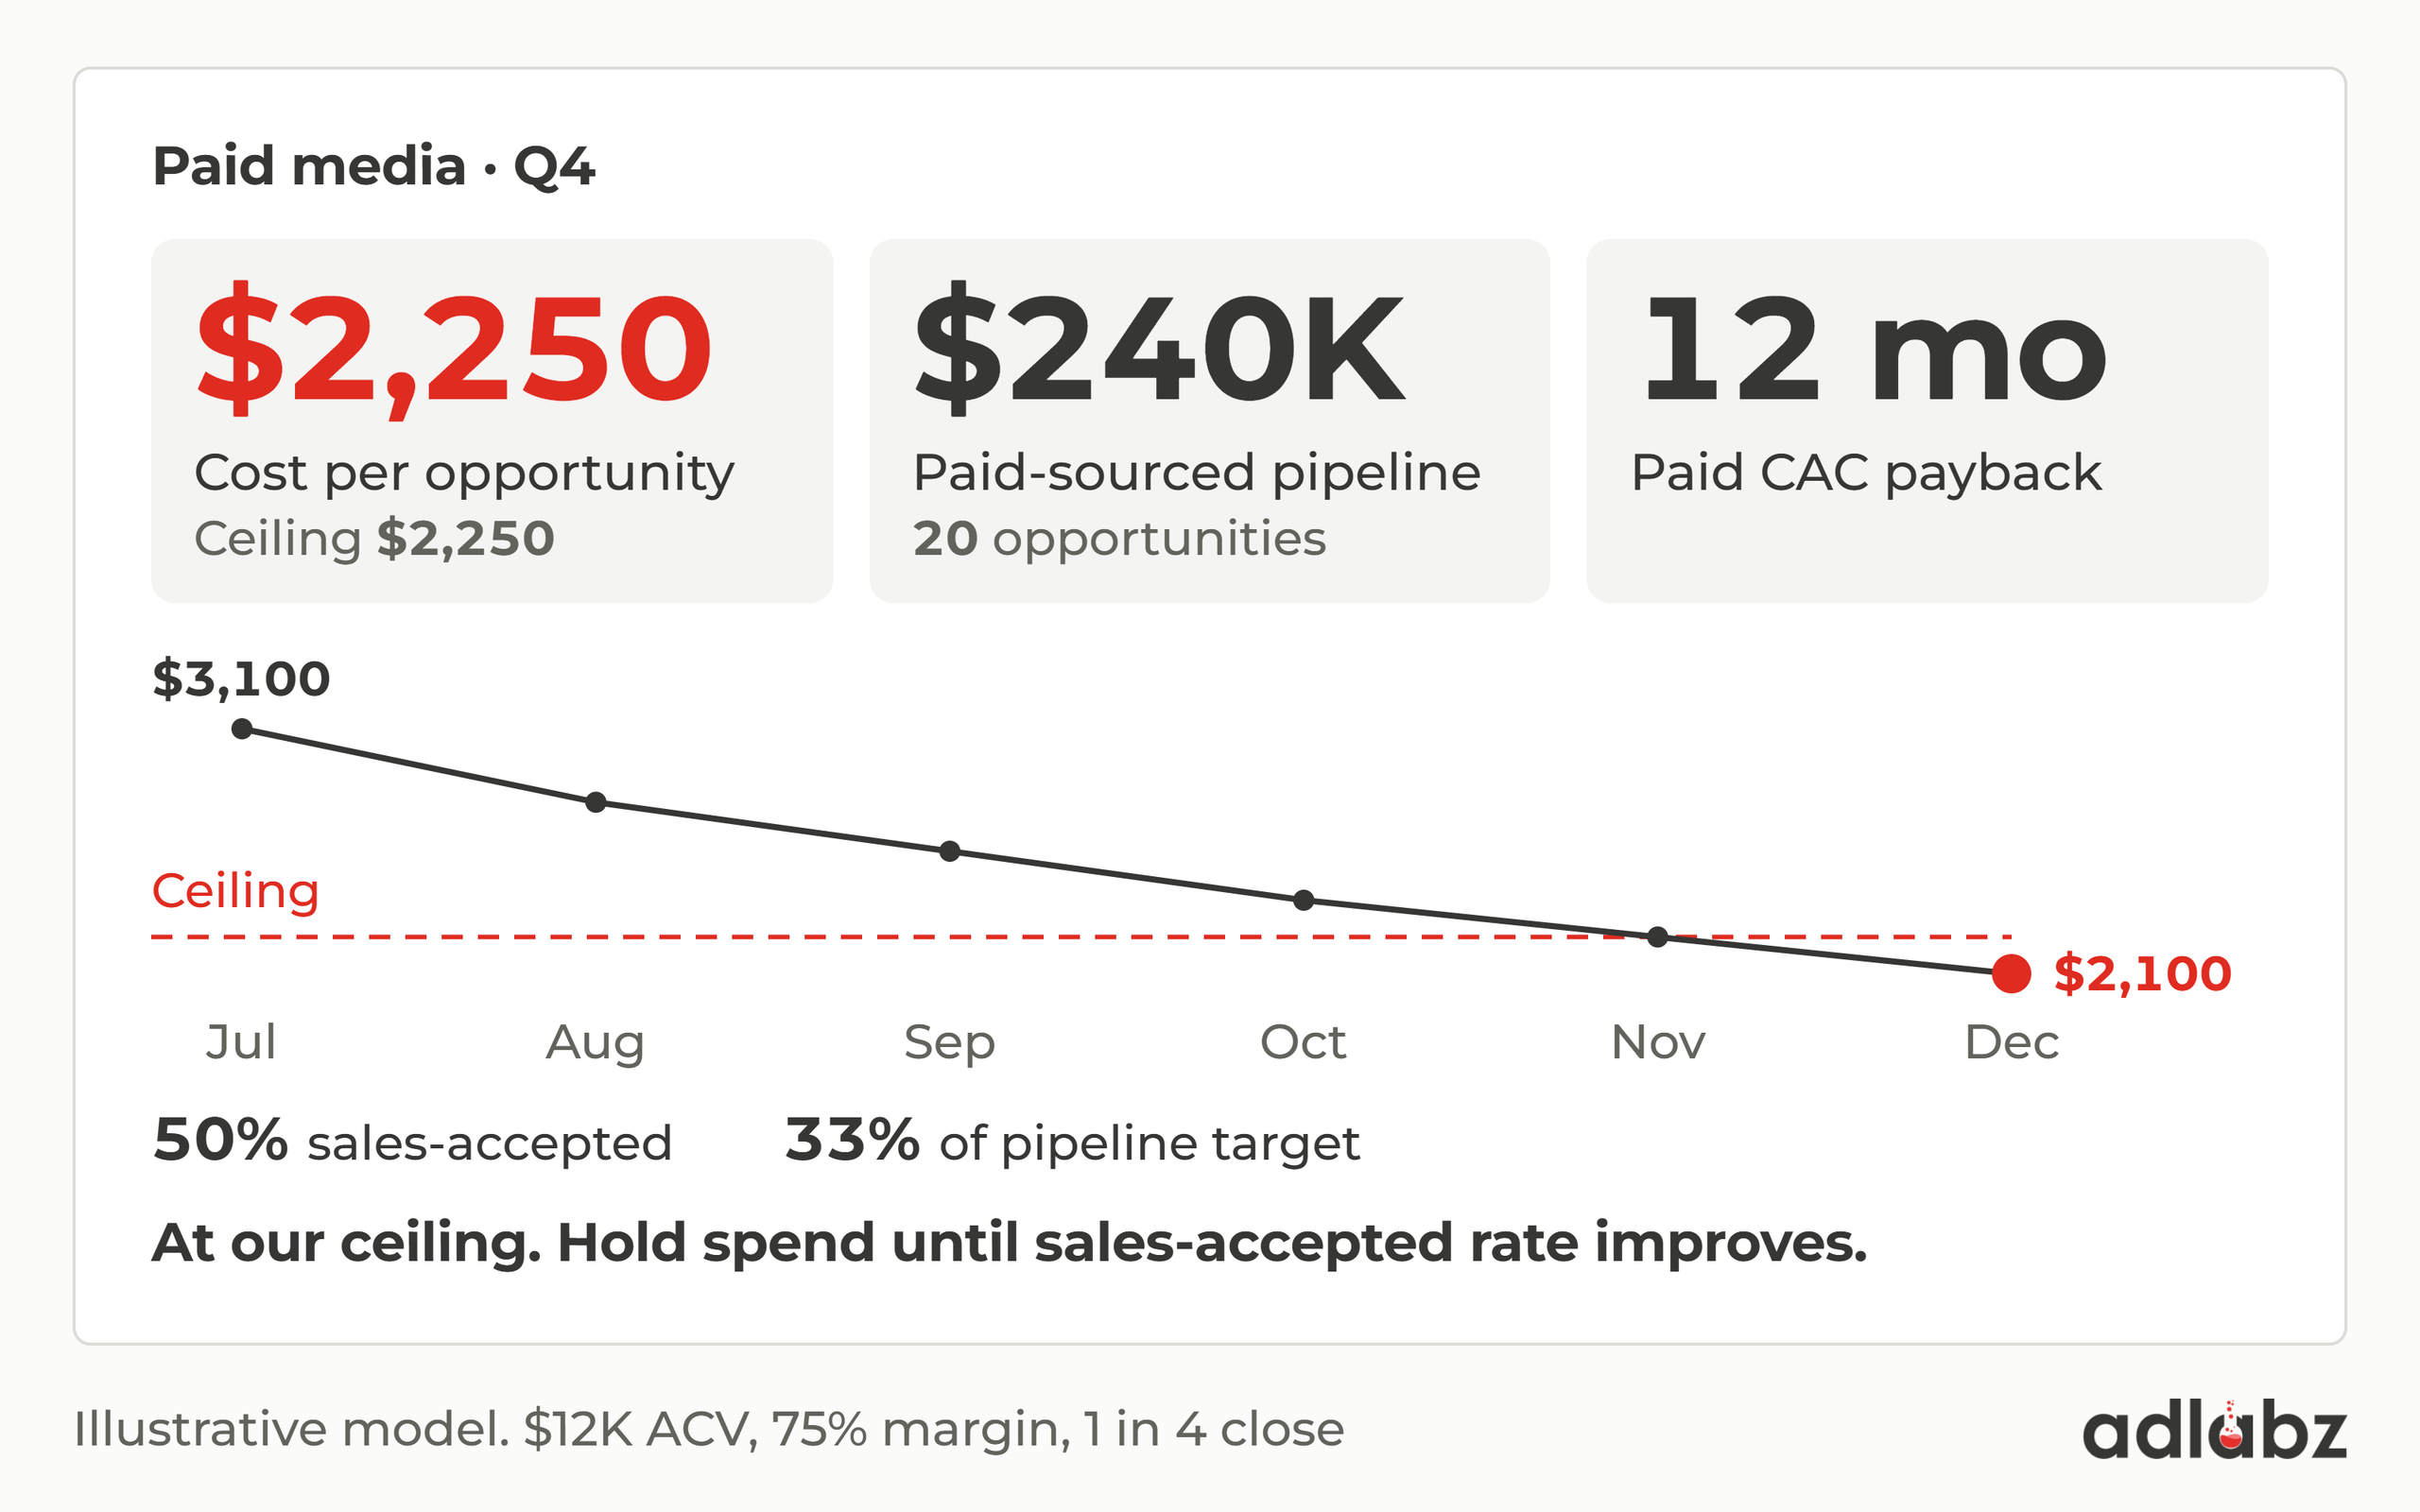
Illustrative quarter ($12K ACV, 75% gross margin, 1 in 4 opportunities close, $15K a month on paid):
| Cost per opportunity | Paid-sourced pipeline | Paid CAC payback |
|---|---|---|
| $2,250 (ceiling $2,250) | $240K (20 opportunities) | 12 months |
- Trend: cost per opportunity by month for the last two quarters, with the ceiling drawn as a line.
- Below it: sales-accepted rate, and paid’s share of the pipeline the quarter’s target needs (here, $240K of $720K, or a third).
- Verdict: “Paid is producing opportunities at our ceiling and covering a third of the pipeline target. We recommend holding spend until the sales-accepted rate improves.”
The verdict line matters most. A board remembers the conclusion, not the chart.
Reconcile the numbers before the meeting
The ad platform, your CRM and finance will report three different numbers for what paid produced. Google may say 64 conversions while HubSpot shows 7 opportunities and finance has a third figure. If the board finds the gap before you do, every number on the slide loses credibility.
Before the meeting, agree on one source per metric (the “source of truth” column in the table above) and tell the board which one you used. If your CRM data never makes it back into Google Ads, offline conversion tracking is usually the first fix, because it lets Google optimise toward opportunities instead of form fills.
Where this approach falls short
- Very early accounts. If paid has produced only a handful of closed deals, CAC payback rests on too little data to mean much. Lead with cost per opportunity against the ceiling, and add payback once at least a couple of dozen opportunities have reached a decision.
- Long sales cycles. If deals take six months or more to close, this quarter’s payback reflects last year’s spend. Show cost per opportunity as the leading signal and payback as the lagging confirmation.
- Your own assumptions. The ceiling depends on your real close rate and gross margin. A 1 in 6 close rate instead of 1 in 4 drops the ceiling from $2,250 to $1,500. Use your own figures, not the illustrative ones in this post.
FAQ
What is a good CAC payback period for B2B SaaS?
About 12 months is the common rule of thumb, but payback varies a lot with contract size. Benchmarkit’s 2025 SaaS Performance Metrics report notes that payback is closely tied to ACV, with large-contract companies paying back faster than those in the $25K to $100K range. The same report puts median new CAC at $2.00 of sales and marketing spend per $1.00 of new customer ARR. Compare yourself with companies at a similar ACV, not with the whole market.
Should MQLs go in the board deck?
Usually not. MQLs are a marketing-internal stage, so a board can’t tell whether they’re good or bad. Sales-accepted leads, opportunities and pipeline in dollars are clearer.
How do I calculate cost per opportunity?
Divide paid spend for the period by the number of opportunities whose original source was paid, using your CRM’s opportunity records rather than the ad platform’s conversion count.
How often should paid be reported to the board?
Quarterly, in line with the board cycle, with a monthly trend line so the board can see direction, not only a snapshot.
Want a weekly breakdown like this? Subscribe to Paid to Pipeline, our founder’s weekly newsletter for B2B SaaS teams whose paid spend has outgrown its proof.
If your ad platforms, CRM and finance can’t agree on what paid produced, that’s where an Ads Autopsy starts: we find where your paid number breaks before anyone talks about budget.