



Oct 28, 2026 · @Ad Labz Ops
Table of Contents
Your SaaS spent $42,000 on paid media last quarter. Ads Manager shows a healthy $180 cost per lead. Then someone on the board asks a simple question: what pipeline did that money create?
If the room goes quiet, you are not alone. Most B2B SaaS teams can tell you their CPL, CTR and conversion rate to two decimal places. Far fewer can tell you their cost per opportunity.
That is the number your board actually wants. It connects ad spend to the part of the funnel sales and finance trust. It also tells you, faster than revenue does, whether paid is becoming a repeatable growth channel.
This guide explains what cost per opportunity is, why it beats CPL for Seed to Series B companies, how to pull it from your CRM, and how to present it upward without a spreadsheet war.
What is cost per opportunity, and why does your board care more than CPL?
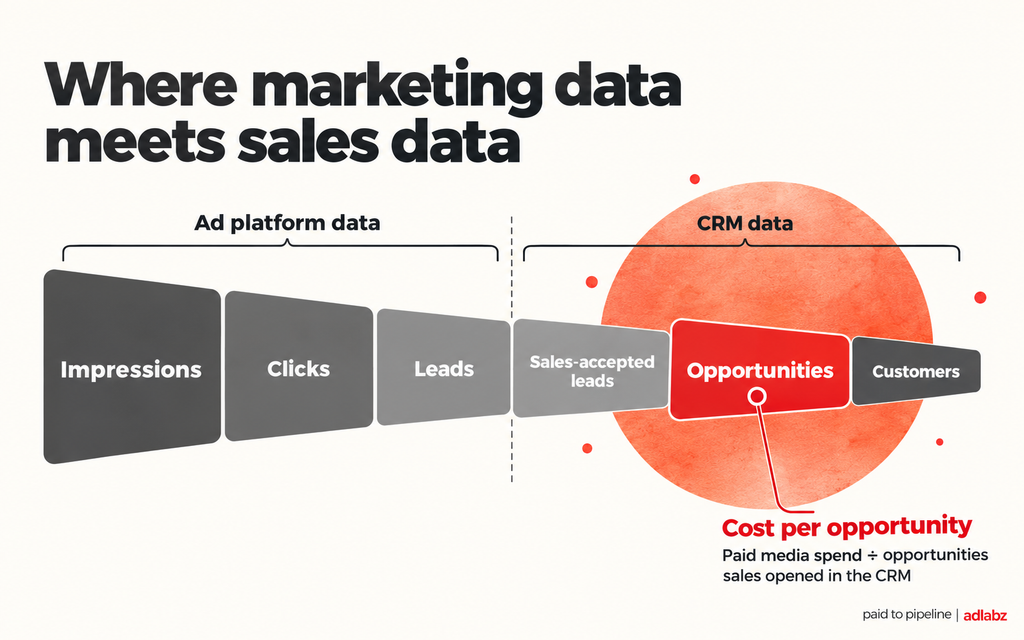
Cost per opportunity is your paid media spend divided by the number of sales opportunities that spend produced. An opportunity here means a deal your sales team has accepted and opened in the CRM, not a form fill.
The formula is simple:
Cost per opportunity = paid media spend ÷ paid-sourced opportunities created
So if you spent $25,000 on Google and LinkedIn in a month and that spend created 19 qualified opportunities, your cost per opportunity is about $1,316.
Why isn't cost per lead enough?
CPL measures how cheaply you can get someone to fill in a form. It says nothing about whether that person had budget, authority or a real problem to solve.
Ad platforms optimize toward whatever you tell them is a conversion. If that conversion is a lead, they will find you cheaper leads. Very often, cheaper leads come from smaller companies, students, competitors and people who wanted a free template.
Your board does not fund leads. It funds growth. Opportunities sit much closer to revenue, and they are counted by sales, not by the ad platform. That makes cost per opportunity harder to game and easier to trust.
Why not wait for cost per customer instead?
Customer acquisition cost is the number that ultimately matters. The problem is time.
With a 60 to 120 day sales cycle, a campaign launched in January may not show closed revenue until spring. By then you have spent another two or three months of budget without a clear signal.
Cost per opportunity gives you a reliable read within weeks. It is the earliest metric in the funnel that sales, marketing and finance can all agree on.
Why does a low CPL so often hide expensive pipeline?
Because the cheapest leads are rarely the best buyers. The gap only shows up when you follow those leads into the CRM.
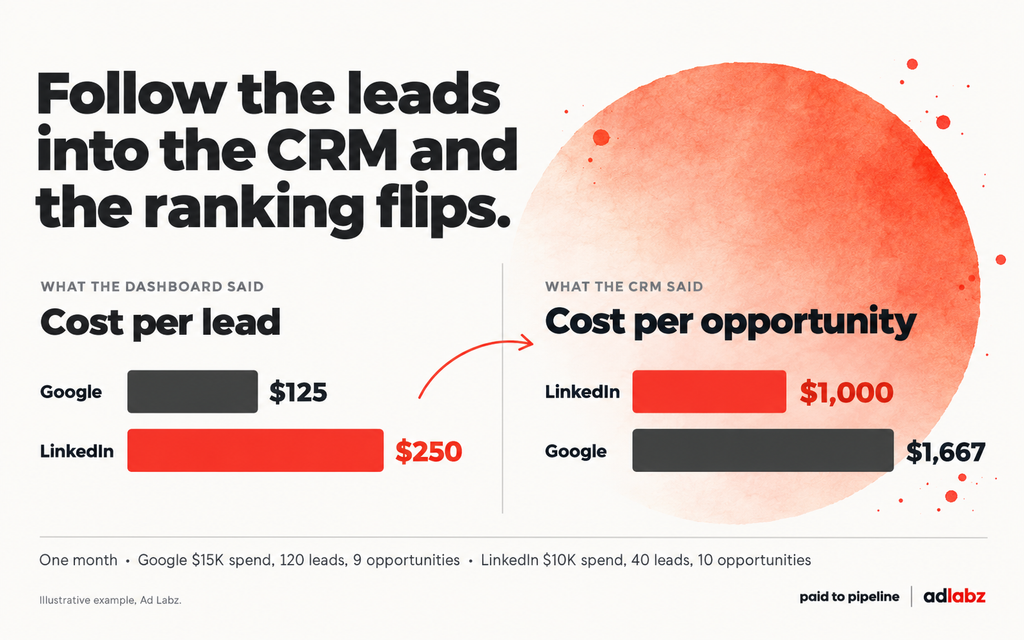
Here is an example based on the kind of account we see often. A Series A SaaS company spends $25,000 a month across Google Search and LinkedIn. Looking only at CPL, Google wins easily. Looking at cost per opportunity, the picture flips.
| Metric (one month) | Google Search | LinkedIn Ads |
|---|---|---|
| Media spend | $15,000 | $10,000 |
| Leads (platform conversions) | 120 | 40 |
| Cost per lead | $125 | $250 |
| Sales-accepted leads | 30 | 22 |
| Opportunities created | 9 | 10 |
| Lead-to-opportunity rate | 7.5% | 25% |
| Cost per opportunity | $1,667 | $1,000 |
Illustrative example. Your numbers will differ by market, contract value and sales process.
If this team set next month's budget by CPL, they would move money from LinkedIn to Google. They would be moving it toward pipeline that costs 67% more.
Is a higher CPL ever the better outcome?
Yes, and more often than most dashboards suggest. Tighter targeting, a harder-working form or a demo-only offer usually raises CPL. It can also raise lead quality enough to cut the cost of each real deal.
This is where many agency relationships go wrong. The agency reports a 25% drop in CPL. Sales reports that lead quality got worse. Both are right, and only cost per opportunity tells you which one matters.
How do you pull cost per opportunity from your CRM?
The math takes ten seconds. The work is in making sure the CRM can answer the question. Here is the process we use when setting this up for a SaaS team for the first time.
1. What counts as an opportunity in your business?
Agree on one definition with sales before you count anything. A good definition is specific and tied to a stage in the CRM, for example: "a deal created after a completed discovery call, with a named buying contact and a fit with our ICP."
Avoid counting every booked demo. No-shows and obvious misfits will inflate the number and make paid look better than it is. Once the definition is set, write it down and do not change it mid-quarter.
2. Can the CRM tell which opportunities came from paid?
This is where most setups break. The lead knows it came from a LinkedIn ad. The opportunity, created weeks later by a sales rep, often does not.
To fix it, capture UTM parameters and ad click IDs in hidden form fields, and store them on the contact record. Then make sure that source carries over to the deal. In HubSpot, the contact's original traffic source and the deal's associated contacts usually do this job. In Salesforce, it is typically the primary campaign source on the opportunity.
Ask your RevOps lead or admin one question: "If I filter opportunities created last quarter by original source, can I see which ones came from paid search and paid social?" If the answer is no, fix that before anything else.
3. Which attribution rule should you use?
Pick one rule and keep it. For most Seed to Series B teams, a simple first-touch or "paid-sourced" rule works well: an opportunity counts as paid if the contact's first known touch was a paid ad.
Multi-touch models can come later. Early on, a consistent simple rule is far more useful than a sophisticated one nobody trusts. Attribution is there to support budget decisions, not to settle arguments about credit.
4. How do you handle the sales-cycle lag?
Leads do not turn into opportunities on the same day. If your typical lag is three to six weeks, last month's spend will not have produced all of its opportunities yet.
The cleanest fix is to measure on a trailing 90-day window. Divide 90 days of paid spend by the opportunities created from paid in those same 90 days. Roll it forward each month. This smooths out the lag and the month-to-month noise.
5. What goes in the spend number?
For the core metric, use media spend only, split by channel. Keep agency fees and tools in a separate, fully loaded version for the CAC conversation. Mixing them into one number makes it hard to compare channels or months.
What is a good cost per opportunity for B2B SaaS?
There is no universal benchmark worth trusting. A $3,000 opportunity is a bargain for a $60,000 contract and a disaster for a $6,000 one. The right target comes from your own unit economics.
The good news is that you can work it out in four steps.
How do you work backwards from contract value?
Start with what a customer is worth, then decide what you can afford to pay to win one.
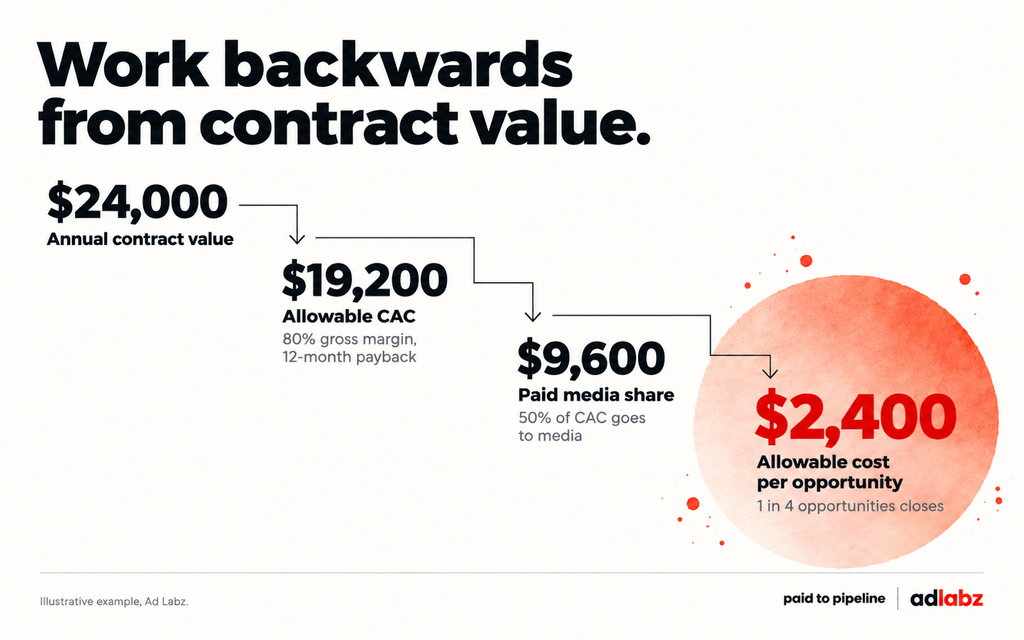
Take a company with a $24,000 annual contract value and 80% gross margin. If the board expects CAC to pay back within 12 months, the most it can spend to win a customer is $19,200.
Not all of that can go to media. Sales salaries, tools and marketing team costs also sit inside CAC. Say the team allows half of it for paid media. That leaves $9,600 of media spend per new customer.
Now bring in the close rate. If sales wins one in four opportunities, every customer needs four opportunities. So the maximum this company should pay for a paid opportunity is $9,600 ÷ 4 = $2,400.
In the example earlier, blended cost per opportunity was about $1,316. That is well under the ceiling, which is a strong case for scaling spend rather than cutting it.
What if you don't know your close rate yet?
Use the last two or three quarters of all opportunities, not just paid ones, as a starting point. Then replace it with the paid-only close rate once you have 20 to 30 closed paid opportunities.
It is also worth checking whether paid opportunities close at a different rate from referrals or outbound. They often do. If paid deals close at half the rate, your allowable cost per opportunity is half as high too.
How should you report cost per opportunity to the board?
Keep the paid media slide to one page and four numbers. Boards want to see whether the channel is working and whether more money would work too. They do not want a tour of the ad accounts.
The four numbers we recommend are paid media spend, opportunities created from paid, cost per opportunity against your allowable ceiling, and pipeline value created. Show each one on a trailing 90-day basis, with the previous quarter beside it.
Pipeline value turns the story into something finance recognizes. In our example, 19 opportunities at a $24,000 contract value is $456,000 of pipeline from $25,000 of media. That is roughly $18 of pipeline for every dollar spent.
What should you leave off the slide?
Leave off CTR, CPC, impressions and platform conversion counts. They are useful for the team running the campaigns, but on a board slide they invite the wrong questions.
If a board member asks about CPL, answer it, then bring the conversation back to cost per opportunity. That one move changes the discussion from "are ads cheap?" to "is paid building pipeline at a price we can afford?"
How do you show progress before deals close?
Add one line on what happened to last quarter's paid opportunities: how many are still open, how many closed won, and how many were lost. Over time this builds the paid-only close rate, and it shows the board you are tracking quality, not just volume.
Which mistakes make cost per opportunity misleading?
The metric is only as honest as the data behind it. These are the mistakes we see most often when auditing SaaS paid programs.
Are you counting brand search as new demand?
People who search your company name usually already know you from a referral, a podcast or outbound. Branded search captures that demand rather than creating it. Report brand and non-brand separately, or brand campaigns will make the whole channel look cheaper than it is.
Are expansion deals and existing customers sneaking in?
Current customers sometimes click ads before booking an upsell call. If those deals land in your paid opportunity count, they flatter the number. Filter for new business opportunities only.
Are low-quality opportunities being created to hit a target?
Once cost per opportunity becomes a goal, there is pressure to open deals that should not exist. Watch for opportunities closed lost within a week or two. If that share climbs, tighten the definition with sales rather than celebrating the lower cost.
Are you judging the channel too early?
A new LinkedIn program in its first 30 days will almost always look expensive. Audiences are still learning, and the sales lag has not played out. Give a new channel a fair 90-day window before you make a keep or kill call.
Can your team answer these four questions today?
Before your next budget meeting, see if you can answer these four questions straight from the CRM:
- How many new business opportunities did paid create in the last 90 days?
- What did each one cost, by channel?
- What is the highest cost per opportunity your contract value and close rate can support?
- What happened to last quarter's paid opportunities?
If any answer needs a long export and a week of debate, the measurement system needs work before the budget does.
What is the difference between cost per SQL and cost per opportunity?
A sales-qualified lead is a person sales has agreed to work. An opportunity is a deal sales has opened. Cost per SQL is a useful early signal, but opportunities are closer to revenue and harder to inflate.
How often should we review cost per opportunity?
monthly, on a trailing 90-day window. Weekly views are too noisy for most Seed to Series B budgets.
Does cost per opportunity replace CAC?
No. It is the leading indicator. CAC and payback are the outcomes it predicts, and you should report both once you have enough closed deals.
Where should you start if you can't see this number today?
Start with the opportunity definition and the source field, not the campaigns. Most SaaS teams we speak with have perfectly reasonable ad accounts sitting on top of a CRM that cannot connect a deal back to the ad that started it.
Once cost per opportunity is visible, the rest of the decisions get easier. You can see which channel deserves the next $10,000. You can hold your agency to a number sales agrees with. And you can walk into the board meeting with an answer instead of a dashboard.
The decision rule: set paid budgets by cost per opportunity against your allowable ceiling, never by cost per lead alone.
Before you can trust your cost per opportunity, the account feeding it has to be set up right. Our free SaaS Ads Autopsy Checklist walks through 14 checks in about 45 minutes. And if you are already spending $5,000 or more a month and still cannot connect paid to qualified pipeline, book a free Ads Autopsy with our team.